How Is Data Visualization Accomplished?
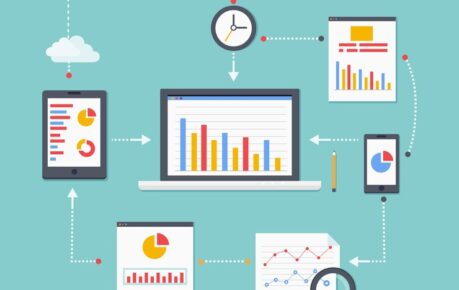
DataTheta recognizes the significance of data visualization tools in data discovery solutions. After understanding the information content of the data and ingesting the appropriate data, we design an ELT pipeline to consume data at a finer granularity. Our team then creates a data consumption platform that allows users to readily display and analyze data insights for data-driven decision-making.
Compelling data stories leads to confident business decision making.
Data visualization tools are an important component at DataTheta, and how they affect your business is discussed in detail below. We are passionate about offering our customers the data visualization tools they need to maximize the value of their data.
1. Capture insights that are missed in conventional reports
By graphing data, viewers can easily spot anomalies and other irregularities that could go unnoticed in text-only reports. In detail discussed below
- Data visualization tools can help identify patterns and relationships that might be difficult to see in traditional reports.
- By presenting data visually, users can
quickly and easily spot trends and
anomalies that might have gone
unnoticed.
2. Unlock key values from large data sets
We’ve developed data visualization tools that simplify extracting useful insights from large datasets to benefit consumers seeking to make better-informed choices. The following is also discussed
- Data sets can be overwhelming, making it difficult for users to extract insights.
- Data visualization tools can help users
focus on the most relevant data points,
allowing them to extract key insights and
make informed decisions.
3. Engage your users with appealing data presentation and insights
Users can effectively communicate their findings using DataTheta’s features by creating eye-catching charts, graphs, and other visual representations of their data. Furthermore, as follows
- Data visualization tools can make data
more engaging and interesting, improving user engagement and adoption. - By presenting data visually appealingly,
users are more likely to be interested in
exploring the data and gaining insights.
4. Easy to understand the data stories
Users can quickly and easily understand what their data is saying and act on it thanks to data visualization tools, which present data clearly and concisely. In full depth, addressed below
- Data visualization tools can help users
understand the “story” behind the data. - By visually presenting data, users can
quickly understand the relationships
between different data points and how
they relate to the narrative.
5. Identify hidden data patterns
Users can quickly and easily recognize these patterns and trends using our data visualization tools, resulting in better decision-making and the discovery of novel insights. Moreover, as continues to follow
- Data visualization tools can help identify ways and relationships that might not be apparent in raw data.
- By presenting data visually, users
Data Discovery: Uncovering Hidden Gems in Your Data with DataTheta.
At DataTheta, we believe that by following these five steps, we can assist our clients in realizing the full value of their data and driving growth through self-service analytics tools.
Need Identification
At DataTheta, we work closely with our clients to identify their unique data needs and understand their business goals. This enables us to tailor our self-service analytic tools to their needs, ensuring they can access the data and insights required to make sound decisions.
Data Source Profiling
We help our clients identify and profile their data sources to ensure they can access the right data. This includes understanding the structure of the data, its quality, and any data lineage information that may be relevant.
Data Orchestration and Data Warehouse
Our team has extensive experience building and managing data warehouses and orchestrating data movement from multiple sources into these warehouses. We work with our clients to design a robust and scalable data architecture that can handle the required volume and variety of data.
Incorporate Best-Practices Visualization Principles
Data visualization tools are critical to self-service analytics tools, so we incorporate
best-practices visualization principles into our service. This includes choosing the right chart types, using color effectively, and providing clear labels and legends.
Implement Data Stories
We use data storytelling techniques to help our clients tell compelling stories with their data. This includes presenting data understandably and engagingly for the audience and using narratives to provide context and meaning to the data.
Train and Support Your Team
At DataTheta, we provide comprehensive training and support to our clients to ensure they can get the most out of our self-service analytics tools. This includes training on our data visualization tools and techniques and ongoing support to help our clients overcome any challenges they may face.
We partner with you to transform your company into a data-driven enterprise.
Our Team
Checkout our featured resources to know about our thought leadership, cases studies and more. We are all ears for you. Let us discuss if you have any queries.
Resources
Checkout our featured resources to know about our thought leadership, cases studies and more. We are all ears for you. Let us discuss if you have any queries.
Ready to get started?
From global engineering and IT departments to solo data analysts, DataTheta has solutions for every team.


