

Introduction:
In today’s data-driven world, Power BI has emerged as a leading tool for transforming raw data into actionable insights. However, the true power of Power BI lies not only in its visualization capabilities but also in its robust data modeling features. Effective data modeling lays the groundwork for meaningful analyses and impactful visualizations. In this blog, we will delve into the nuances of mastering data modeling in Power BI, exploring essential concepts and best practices to construct a solid foundation that maximizes the potential of your data.
Understanding Data Modeling:
At its essence, data modeling in Power BI involves structuring data to facilitate analysis and visualization. This begins with importing data from diverse sources, such as databases or spreadsheets, into Power BI Desktop. Subsequently, relationships between different tables are established, calculated columns and measures are created, and the data model is optimized for performance.
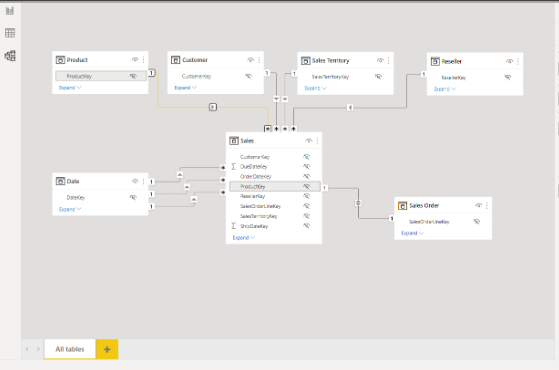
1. Establishing Relationships:
Relationships dictate how tables in the data model are connected. In Power BI, relationships are based on shared fields or keys between tables. By defining relationships, Power BI can perform complex cross-table calculations and aggregations. Understanding the various relationship types (e.g., one-to-one, one-to-many, many-to-many) and selecting the appropriate cardinality and cross-filter direction is crucial based on the data structure and analysis requirements.
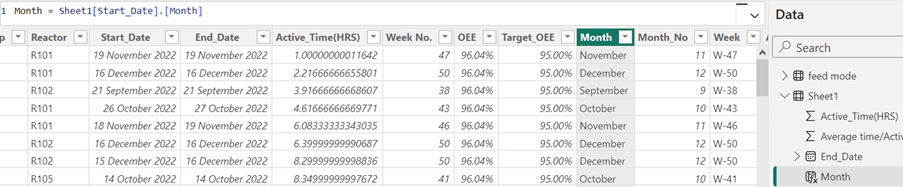
2.Creating Calculated Columns and Measures:
Calculated columns and measures serve as integral elements within the realm of data modeling. Calculated columns allow for the generation of new columns through the application of calculations to existing data, while measures dynamically aggregate data based on predefined conditions. Leveraging DAX (Data Analysis Expressions), the proprietary formula language of Power BI, provides a wide array of functionalities including summation, averaging, and counting. It’s imperative to prioritize simplicity, efficiency, and reusability when crafting calculated columns and measures to uphold maintainability and optimize performance.
3.Optimizing Performance:
Performance optimization is paramount in data modeling, particularly with large datasets or intricate calculations. Employing techniques such as minimizing calculated columns, utilizing appropriate data types, avoiding unnecessary relationships, and optimizing DAX formulas can significantly enhance report responsiveness and efficiency. Additionally, features like query folding, partitioning, and incremental data refresh can further optimize performance.
Best Practices and Tips:
To master data modeling in Power BI effectively, adhere to these best practices and tips:
– Thorough Understanding: Gain a comprehensive understanding of data sources, relationships, and business requirements before constructing the data model.
– Simplicity: Strive for simplicity by minimizing complexity and redundancy in the data model. Simplified models are easier to maintain and troubleshoot.
– Descriptive Naming: Use clear and descriptive names for tables, columns, relationships, and measures to enhance clarity and comprehension.
– Testing and Iteration: Rigorously test the data model with sample data and iterate based on feedback and performance evaluations.
– Stay Updated: Keep abreast of the latest Power BI features and updates to leverage new functionalities and optimizations.
Conclusion:
Developing proficiency in data modeling within Power BI is crucial for establishing a solid foundation conducive to in-depth analysis and engaging visualizations. By grasping fundamental concepts, embracing best practices, and employing optimization strategies elucidated in this guide, users can fully harness the capabilities of Power BI. Whether you’re new to the platform or a seasoned user, dedicating time and effort to mastering data modeling will undoubtedly yield significant benefits, enabling you to make informed decisions and propel business success through data-driven insights.
Follow us for more such updates!